MC5712 Timing Analysis RSU
MetroCount's MC5712 Roadside Unit introduces a new mode of analysis called Timing Analysis, which adds an extra dimension to vehicle classification.
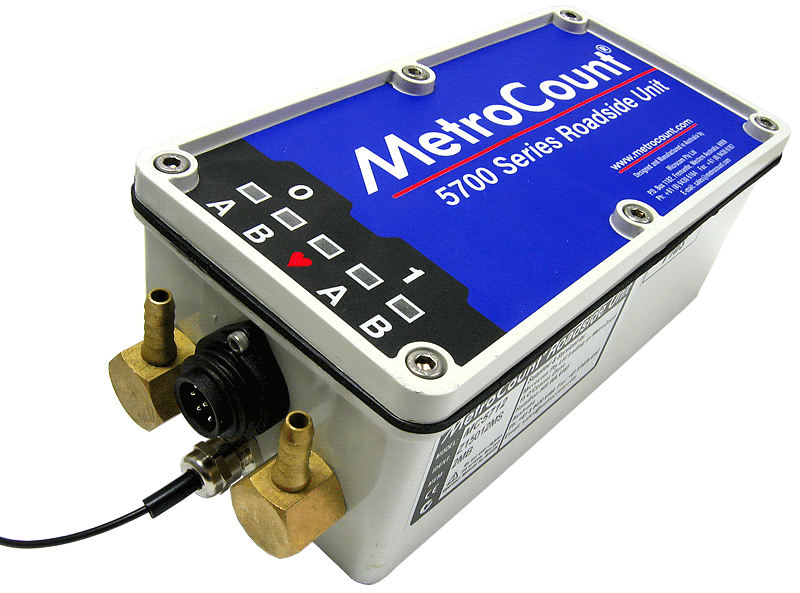
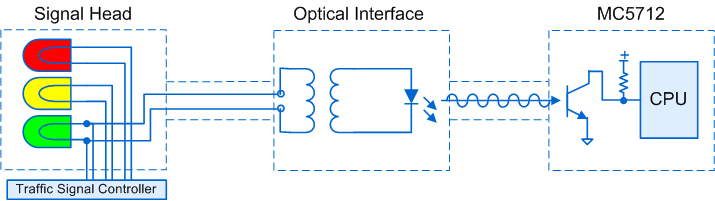
The MC5712 is a two-channel RSU, where channel 0 is used to time-stamp vehicles using tubes, and channel 1 is used to synchronously time-stamp the RSU's fibre optic input. Timing events from the second channel form user-definable Phases, into which vehicles from the first channel are grouped. MCReport provides a range of new Phase reports for detailed analysis and statistics of vehicles grouped by phase, and of the timing source itself.
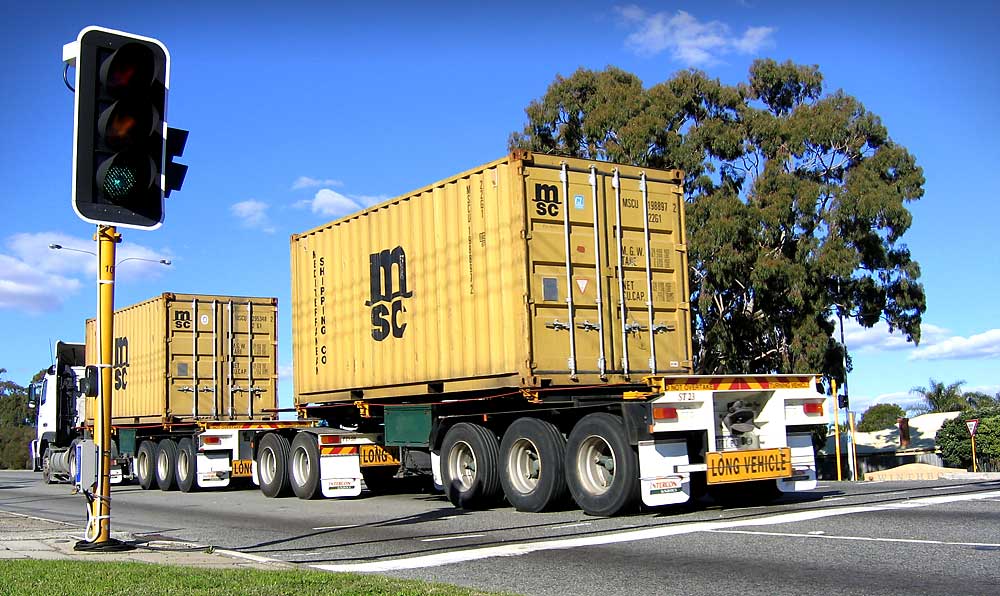
Timing Analysis is of particular use for traffic signals. Tubes are placed the intersection-side of a stop line, and timing is derived from one of the traffic signals facing the corresponding aspect. The resulting data can be used to examine:
- Driver behaviour, especially surrounding phase changes.
- Volume and Speed statistics for each phase.
- Individual vehicle transgressions.
- Performance statistics, such as average cycle times.
- Queuing and Capacity.
Timing Analysis is not limited to traffic signals. The MC5712 can be applied to controlled pedestrian or railway crossings. In fact, any application where there is a detectable timing parameter, can be investigated. For instance, traffic behaviour during icing conditions could be investigated with a simple on-road temperature sensor. Other environmental conditions such as rain or light level could also be used.
The MC5712's optical timing input is connected via a plastic fibre optic cable. This has several advantages:
- Complete electrical isolation of the fibre and RSU from the signal controller.
- No backward channel or possibility of damage to the signal controller.
- Immune from electrical interference.
- Rugged and easily terminated.
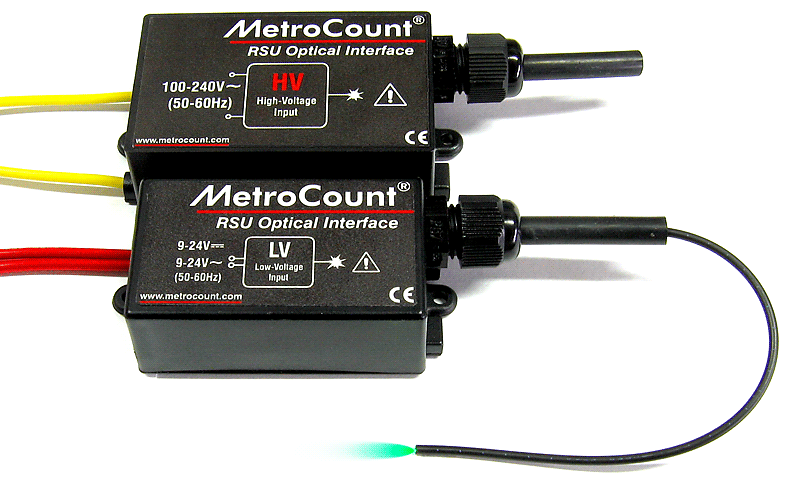
The MetroCount RSU Optical Interface is used to drive the MC5712's optical input. Optical Interfaces are small enough to be mounted directly in a traffic signal head, or can be installed in a controller cabinet, with up to 100 metres of fibre. Optical Interfaces are available in two versions:
-
Low Voltage - for 9-24VDC or 9-24VAC (50-60Hz)
-
High Voltage - for 100-240VAC (50-60Hz)
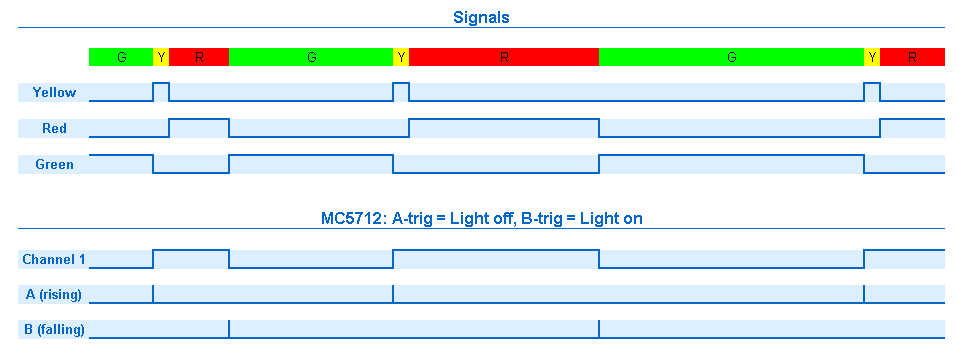
Consider the typical application of a straight-through aspect of a controlled intersection. The start and end of a complete cycle of the traffic signals can be derived entirely from the Green light. With the addition of fixed-length phases during analysis with MCReport, the varying length of the Red phase can be deduced.
The MC5712's timing channel (channel 1) time-stamps transitions on its optical input, called Trigger events. The unit's default configuration is for an Optical Interface connected to the Green signal. The Green light going off will generate an A-trigger, indicating the start of the Yellow. The Green light coming back on then generates a B-trigger, indicating the end of the Red.
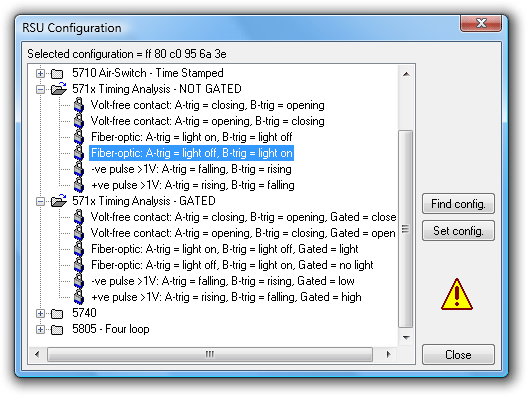
For other applications, the MC5712 can be reconfigured using MCSetup or MCSetLite. Several default configurations are provided to cover most scenarios, and new configurations can be easily created if nothing suitable exists.
For long-term analysis, the vehicle channel can be controlled by the timing channel. In this mode, known as Gated Timing Analysis, vehicles will only be logged when a configurable, static level (high or low) is present on the timing channel. Note that using this mode will result in some loss of information, especially vehicles leading up to and spanning the phase change, but provides much greater vehicle capacity.
Timing Analysis introduces a new signature type called Phase, which provides access to MCReport's Timing Analysis reports, in addition to all the Plus reports.
MCReport's Timing Analysis reports include:
-
Data Phase Report - individual vehicles ordered by phase.
-
Phase Statistics - timing statistics for each phase.
-
Custom List Report - standard Custom List report, filtered by phase.
-
Phase Flow Chart - plot of vehicle volume versus phase.
-
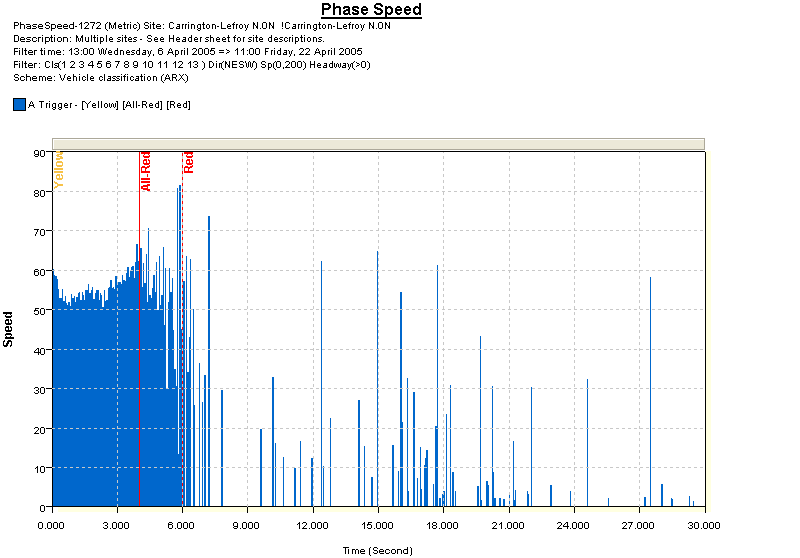
Phase Speed Chart - plot of average vehicle speed versus phase
-
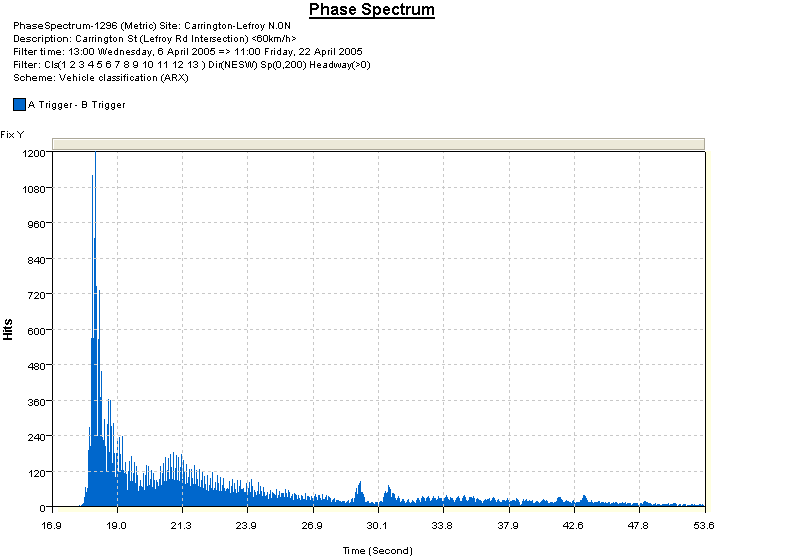
Phase Spectrum - distribution of phase timing.
-
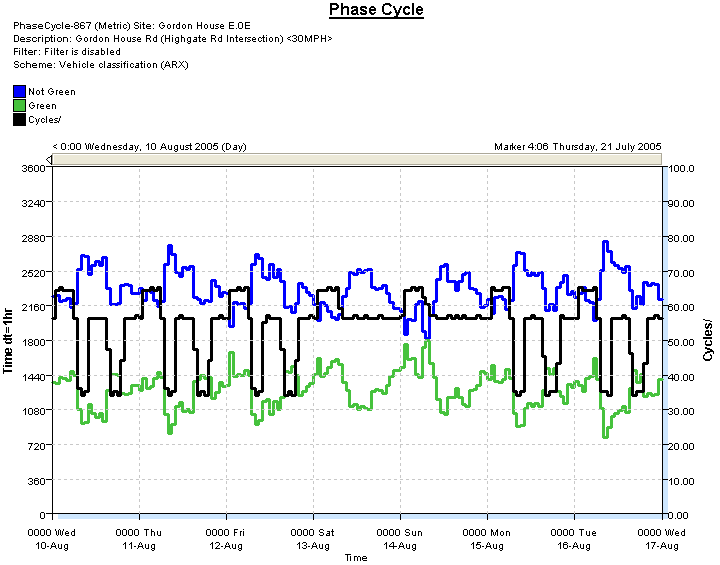
Phase Cycle - average phase length versus time.
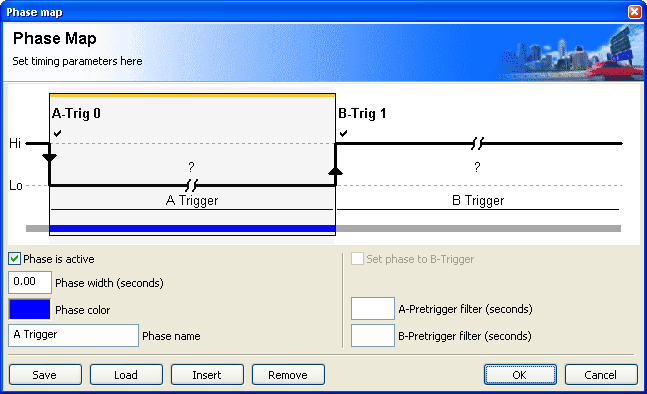
Interpretation of the timing channel data is defined using MCReport's Phase Map, which is displayed as part of the Report Wizard for Phase reports. Initially, MCReport constructs a simple two-phase map for the A and B triggers from the timing channel.
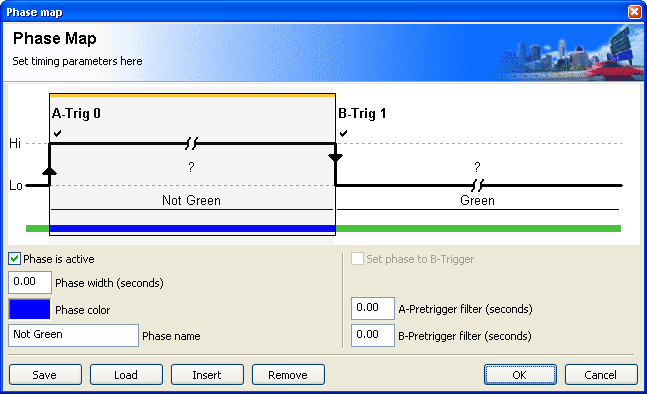
From here, more complex Phase Maps can be constructed by adding phases with fixed lengths, and assigning names and colours to each phase. Phases can be enabled and disabled to examine driver behaviour under combinations of phases, such as only the Yellow and Red phases for traffic signals.
Consider the typical signal timing application described previously. A MC5712 was connected to a pair of tubes, spaced one metre apart, and approximately 200mm on the junction side of a stop line. An Optical Interface was connected by signal technicians to the Green light on the signal pole adjacent to the stop line being monitored. The MC5712's timing channel was configured to detect a rising-edge as the A trigger (light off), and a falling-edge as the B trigger (light on). In it's simplest form, this is represented by the following Phase Map.
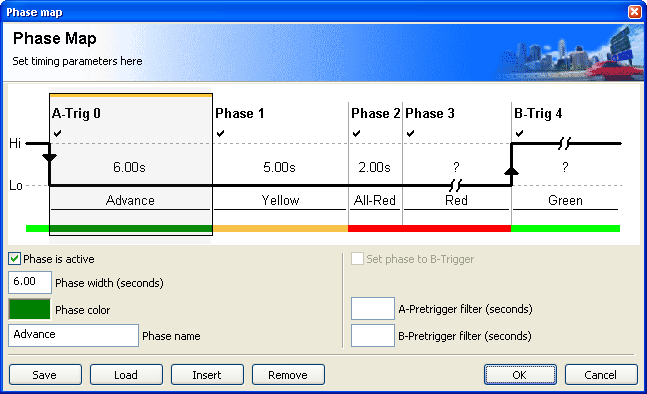
For the intersection in question, several fixed-length phases are known. The Yellow phase is always four seconds, followed by a two-second phase where all aspects of the intersection are Red. These phases can be easily added, so that they may be analysed in detail.
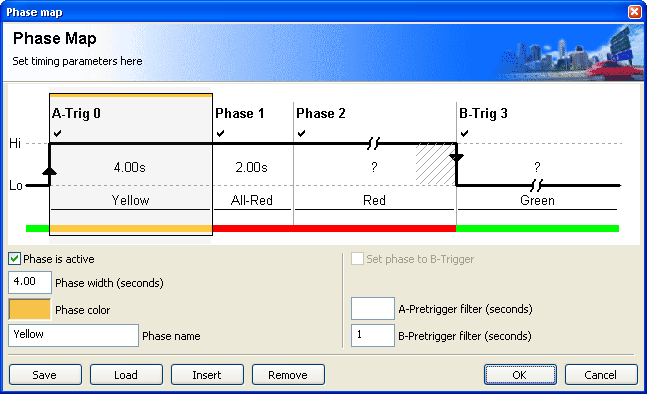
The optional pretrigger filter removes vehicles for a specified window prior to a trigger event. This feature is useful for traffic signals for removing vehicles at the end of a phase that may be jumping the phase transition.
The following sample reports give an insight into the types of information that can be derived from Timing Analysis data.
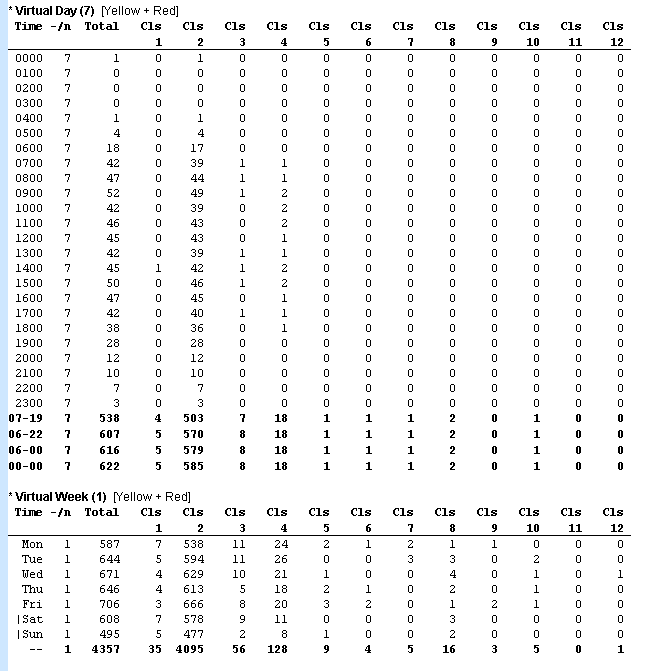
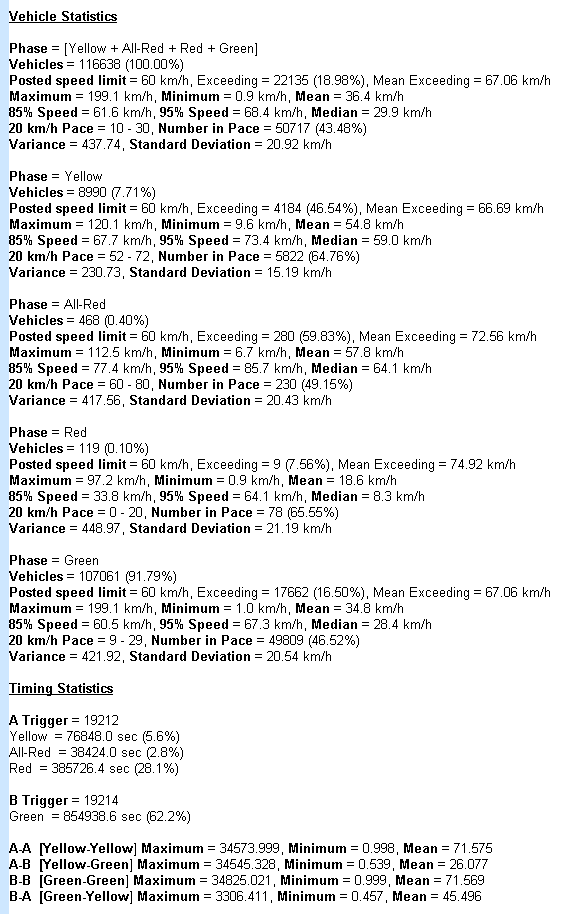
The Phase Statistics report displays MCReport's standard speed statistics block for each phase in the Phase Map, and for all phases combined. A summary block of statistics from the timing channel is also included.
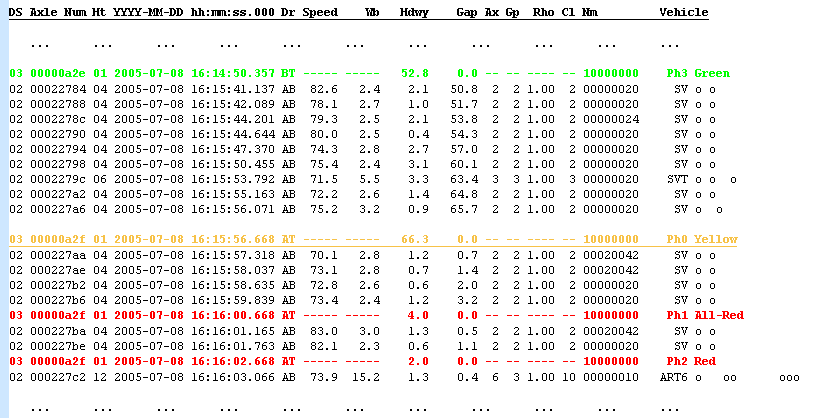
The Data Phase report displays individual vehicles, interspersed with phase timing. Phases can be disabled in the Phase Map to show only vehicles in phases of interest. The Gap column is the time since the last phase transition.
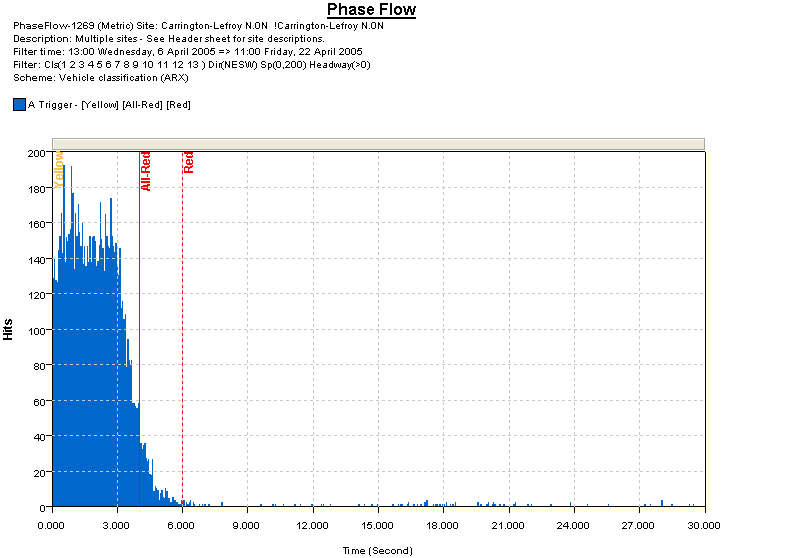
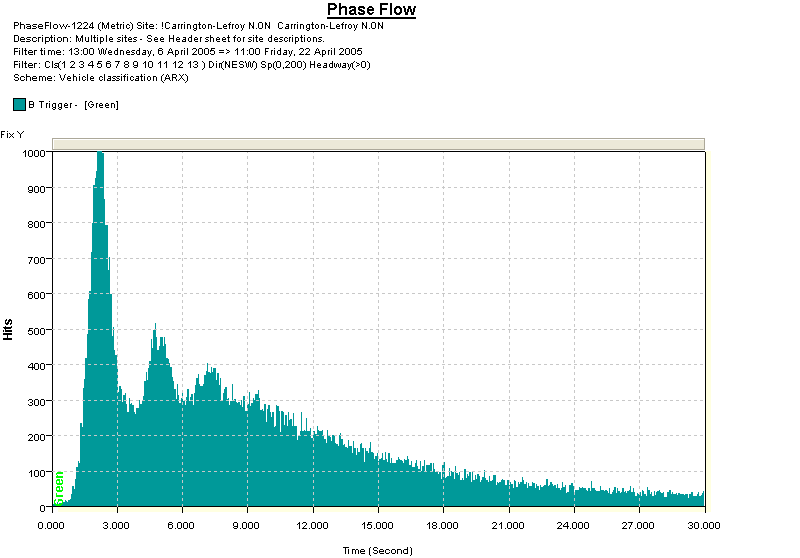
The Phase Flow report represents average vehicle volume versus time from the start of a Phase Map cycle. Each phase is indicated by a vertical line on the chart.
This report is particularly useful for examining driver behaviour, and characterising a given site. For instance, this site shows a definite tail of vehicle flow into the All-Red phase.
Behaviour at the end of a cycle (start of the Green) can also be examined.
The Phase Speed report shows average vehicle speed versus time from the start of a Phase Map cycle. For sporadic events, the average speed may be just a single vehicle.
Like the Phase Flow report, this report highlights driver behaviour. In this case, there is an increase in average speed approaching the Red phases.
The Phase Spectrum report is useful for examining the distribution of time between trigger events. For example, the A-to-B distribution represents the variable cycle length.
The Phase Cycle report plots average phase length (between trigger events) versus time, highlighting the change in behaviour of the timing signal at varying times of the day and week. The total number of cycles can optionally be plotted on the same report.
The following example demonstrates a traffic signal flipping between a demand-driven cycle, and a simple fixed-timed cycle.
A special version of the Custom List report also supports Timing Analysis. Any of the Custom List's features can be applied to selected vehicles using the Phase Map. For instance, complete speed statistics can be calculated for vehicles in the first two seconds of the green, and so on.