Graphical Reports
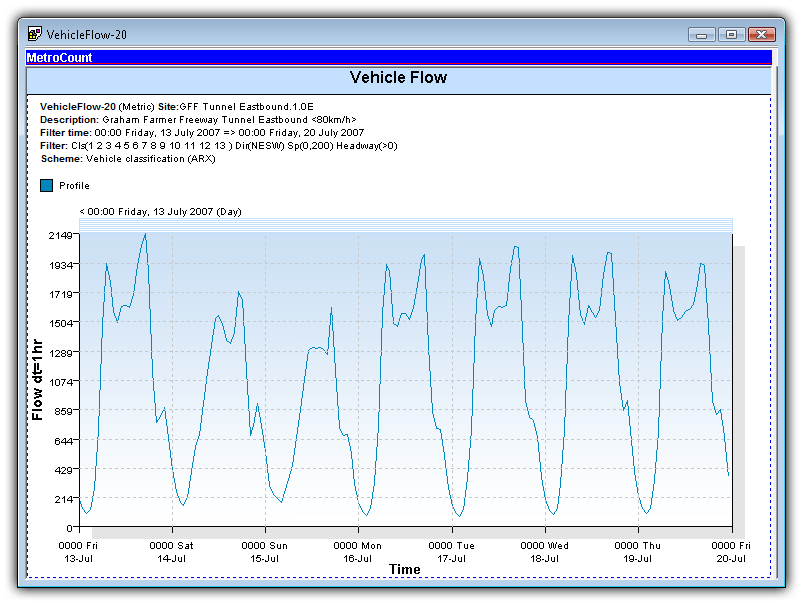
MCReport displays charts and graphs in a unique dual-pane window, with a chart in one pane, and a text report in the other. For reports grouped into the Charts category in the Report Vortex, the chart is presented on the left, with the report's Header Sheet on the right. The Custom List report presents a chart on the right.
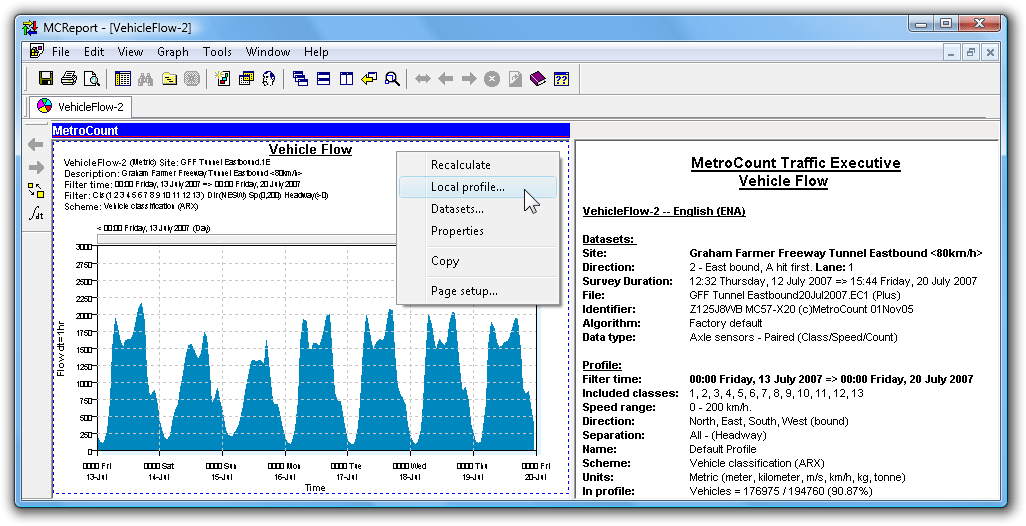
The left pane is always the primary pane. Its right-click menu contains access to the Local Profile, included datasets, and report properties. The secondary pane's right-click menu contains the other usual functions.
The blue MetroCount bar at the top indicates the currently active pane. Certain functions, such as zooming, can relate to either pane, so only the active pane will be affected. A pane is made active by clicking anywhere within its region.
The default zoom level for a graphical report is fit-to-window, which will maximise the size of the graph for its pane. Moving the splitter bar to one side will dedicate the entire window to the graph.
The zoom level may also be set to a fixed percentage. For values larger than 100%, the scroll bars can be used to move around the report.
For finer resolution in the data itself without changing the size of the report, consider changing the Display Span or Integration Time.
Many of the graphical reports have multiple rendering options. Reports generally default to the most appropriate rendering option, however experimenting with the available options may give better results for a given application.
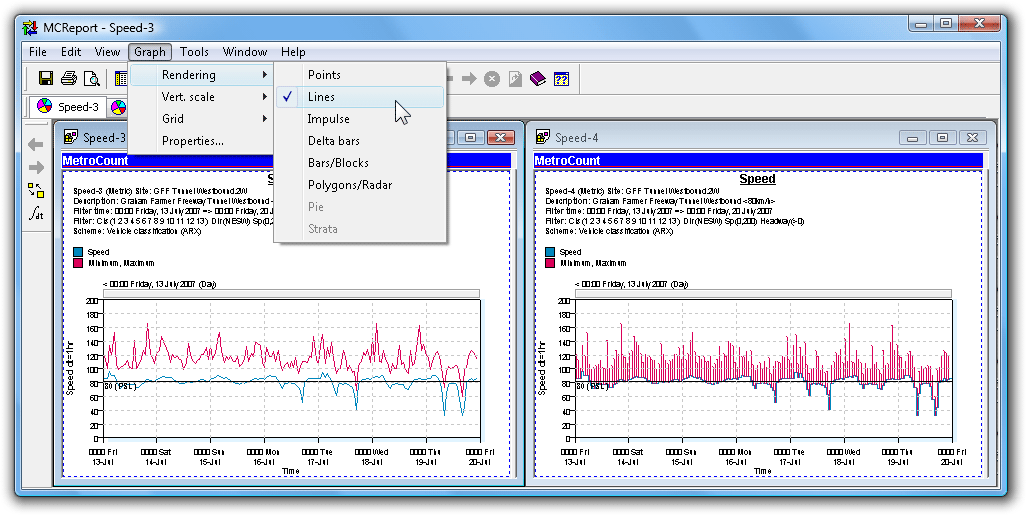
To change the rendering of a graphical report, activate its pane, and select Graph » Rendering from MCReport's main menu. The available rendering options will vary depending on the type of report.
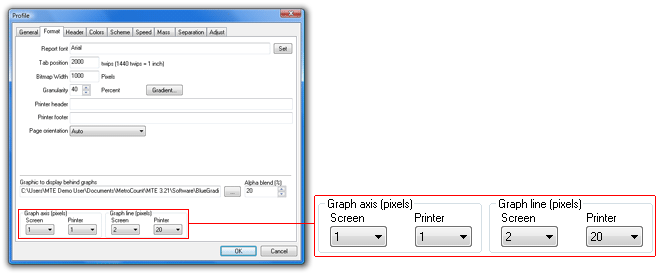
The line-thickness used to draw a graph can also be changed in the Format page of the Advanced Profile options. Thickness can be set independently for on-screen viewing and printing. In general, one-pixel thickness is fine for on-screen viewing, however thicker lines may be required for the higher resolution of printers.
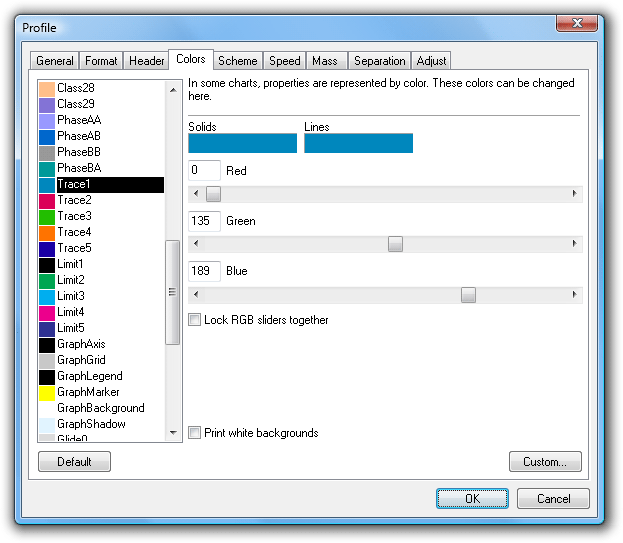
Almost every colour used in a graphical report can be customised via the Colours page of the Advanced Profile options. To change a colour, select it from the list on the left, and use the red, green and blue sliders. The Custom button will display the standard Windows colour-picker.
The general groups of colours are:
- Class - used for class and speed bins.
- Trace - primary colours used by most reports.
- Limit - used for horizontal markers such as speed limits, and vertical markers such as percentiles.
- Glide - used by density plots.
- Phase - used by Phase reports.
There are several options for calculating the vertical scale of a graph. Graphical reports default to the most appropriate method for the type of report. An appropriate number of tick-marks will be automatically selected.
To change the vertical scale of a graphical report, activate its pane, and select Graph » Vert. Scale from MCReport's main menu. The available options will vary depending on the type of report.
| Option | Description |
|---|---|
| Auto | Maximum value of the y-axis will be set to the peak data value. |
| Integer power | Maximum value of the y-axis will be set to the next integer power above the peak data value. For example, for a peak of 390, the maximum y-axis value will be 400. For 8421, the maximum y-axis value will be 9000, and so on. |
| 125 power | Maximum value of the y-axis will be set to the next 1, 2 or 5 integer power above the peak data value. That is, 1, 2, 5, 10, 20, 50, 100, 200, 500, and so on. |
| Custom | A dialog box will be displayed, where the y-axis minimum and maximum values can be entered. |
Time-based plots can be inspected with a pair of crosshairs to examine points of interest. The crosshairs are activated by clicking on the grey bar at the top of the report grid, and dragging across the report. As the crosshairs are moved, the current coordinates are displayed next to the pointer.
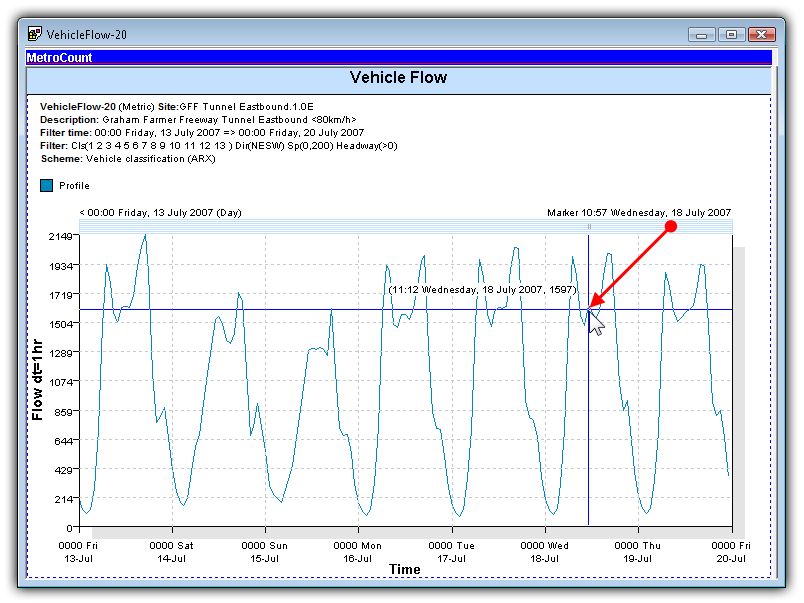
The crosshairs are also used to place a marker on the graph. When the mouse button is released, a vertical marker will be placed at that point. The location of the marker is specified on the top right of the graph. The marker is primarily used for changing the Display Span of a graph.
To clear the marker, simply double-click the grey bar at the top.
The Display Span is the subset of the available data currently shown by a time-based plot. By default, time-based plots are scaled to display the entire data time span. The Display Span may also be changed to a week, day, or hour.
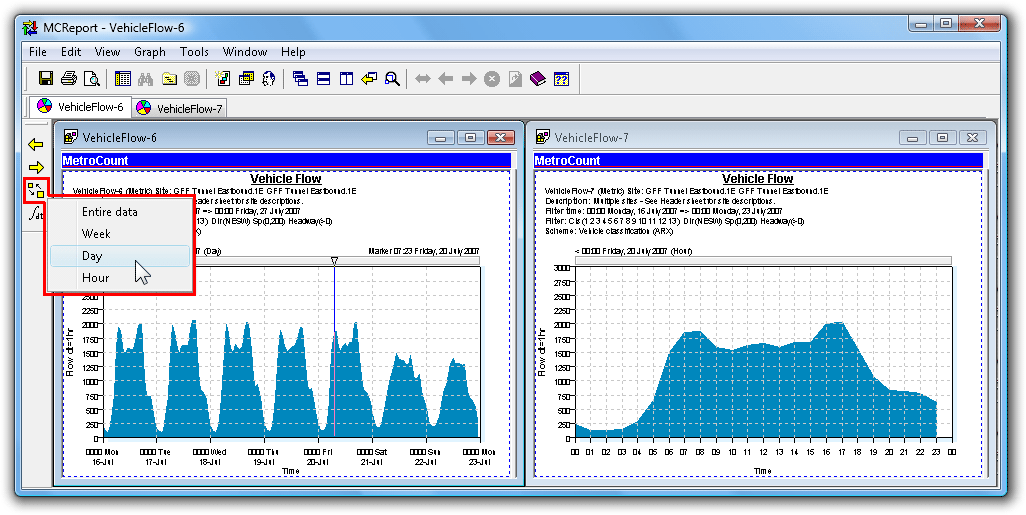
Changing the Display Span requires a marker to be placed at the point on a graph where the new Display Span will start. The new Display Span will actually start on the boundary to the left of the marker. So, for either a week or a day, the marker can be placed anywhere in the day where the new Display Span is required to start. For an hour, the marker may be placed anywhere within the desired hour.
Once the marker has been placed, the desired Display Span can be selected by clicking the Span button on MCReport's graph toolbar, and selecting from the pop-up menu. The new Display Span will automatically appear. To step backwards and forwards through the data at intervals of the Display Span, use the Back and Forward buttons also on the graph toolbar.
The Display Span can be set to start precisely at the marker location by holding down the Ctrl key when selecting the Display Span from the graph toolbar. Note that this may result in odd times for the tick marks on the x-axis. To set the marker with greater precision, hold down the Ctrl key when dragging the crosshairs.
The Integration Time of a time-based plot determines the period of data used to calculate a point on the graph. For example, a Vehicle Flow graph with an Integration Time of one hour will place one point per hour of total vehicles.
The Integration Time is closely related to the Display Span. For instance, with a Display Span of a day, an Integration Time of an hour will give 24 points on the graph. An Integration Time of 10 minutes on the same Display Span will give 144 points, showing much more detail.
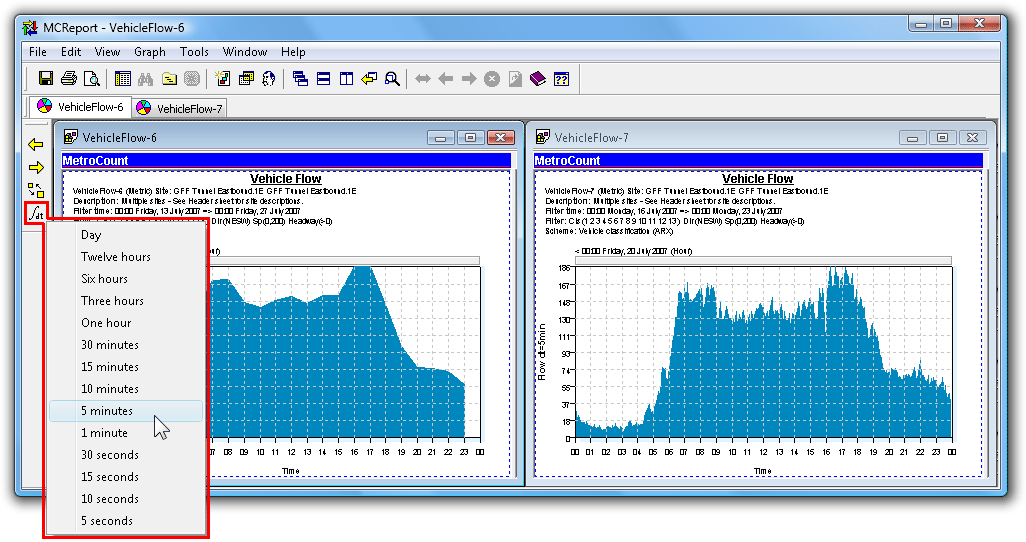
The Integration Time for a time-based plot can be changed by clicking on the Integration Time button on MCReport's graph toolbar, and selecting from the pop-up menu. The graph will automatically redraw with the new Integration Time.
Note that when using a smaller Integration Time the vertical size of the graph will change since fewer vehicles are integrated into each point. Also, selecting a small Integration Time relative to the Display Span may result in an unreasonable number of points to be plotted. In this case a message will be displayed, suggesting a larger Integration Time.
Graphical reports can optionally display an image in the background, such as a colour gradient or watermark.
The background image can be set in the Format page of the report's Advanced Profile options. The intensity of the background image can be adjusted using the Alpha blend percentage. The selected image is automatically scaled to fill the graph area.
Printing split-window reports requires two print operations. Selecting File » Print from MCReport's main menu will only print the currently active pane, indicated by the blue MetroCount bar at the top. To activate the other pane, click anywhere within its window.
Graphical reports can be saved as vector-based Enhanced Metafiles (EMF) or as an image file (PNG, GIF, JPG or BMP). To save a graphical report, select File » Save report as from MCReport's main menu. Remember that the graph must be the active pane, indicated by the blue MetroCount bar at the top.
The output format is determined by the Save as type drop-down list in the Save dialog box. Note that the Save dialog always defaults to the Folder for report output option in MCReport's Global Settings, accessible by selecting Tools » Settings from MCReport's main menu.
Enhanced Metafiles are a vector-based format, making them ideal for inserting graphs into other documents. When an Enhanced Metafile is scaled, everything is redrawn at the new size, producing a high-quality image. The file itself is normally very small.
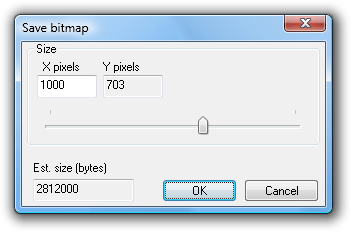
Image files are more widely supported by other software, however they have an inherent size, and rescaling them can often produce unsatisfactory quality. When saving as an image, MCReport displays a dialog box where the dimensions of the image can be set. The required size will depend on the intended use of the image. Only the width needs to be set, so that the correct aspect ratio is maintained.
A graphical report can also be transferred to another application using copy-and-paste. Simply right-click on a graph, and select Copy from the pop-up menu. The graph will be pasted as an Enhanced Metafile if the target application supports it. Otherwise the graph will be pasted as a bitmap at the size shown on screen.