
Weekly Vehicle Counts
The Weekly Vehicle Counts report lists traffic volumes by hour in a weekly format, with one week per page. Each row represents a single hour time step, and the columns represent days of the week, with the actual dates shown.
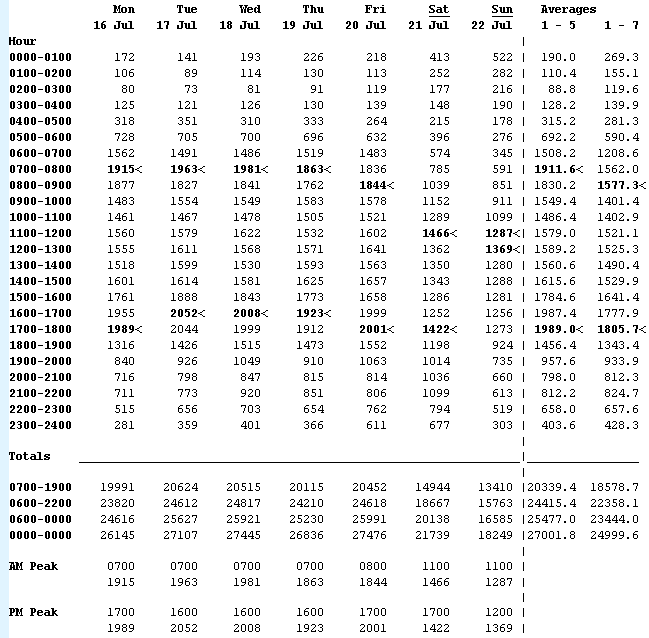
Five-day and seven-day averages are provided on the right side of the report. The five-day average is the average vehicle flow across week-days. The seven-day average is the average vehicle flow across the entire week. Note that weekends are underlined.
12 hour (0700-1900), 16 hour (0600-2200), 18 hour (0600-0000) and 24 hour (0000-0000) totals are included at the bottom of the Weekly Vehicle Counts report. Also included are the AM and PM peak hours for each day, and their respective hourly totals. Note that the AM and PM peaks are also indicated in the hourly totals by a bold typeface and a < character.
An asterisk * in the report matrix represents an hour where data is not available for the entire hour, or has been excluded in the report Profile. Note that this is different to a zero vehicle count for an hourly period, which will be correctly displayed with a 0.
The Weekly Vehicle Counts report does not include totals where there is missing data for any period covered by that total. This prevents results from being displayed that are misleading due to missing data. If totals for partial days of data are required, consider using another report, such as the Vehicle Counts report.
All averages in the Weekly Vehicle Counts report are correctly calculated when there is missing data. For example, a five-day average where two of the days contain no data (asterisks) will be correctly averaged over the three days of actual data.
Note also that the five-day and seven-day averages next to the totals at the bottom of the report are calculated from the all available data. This may not be the average of the daily totals if partial days are included.
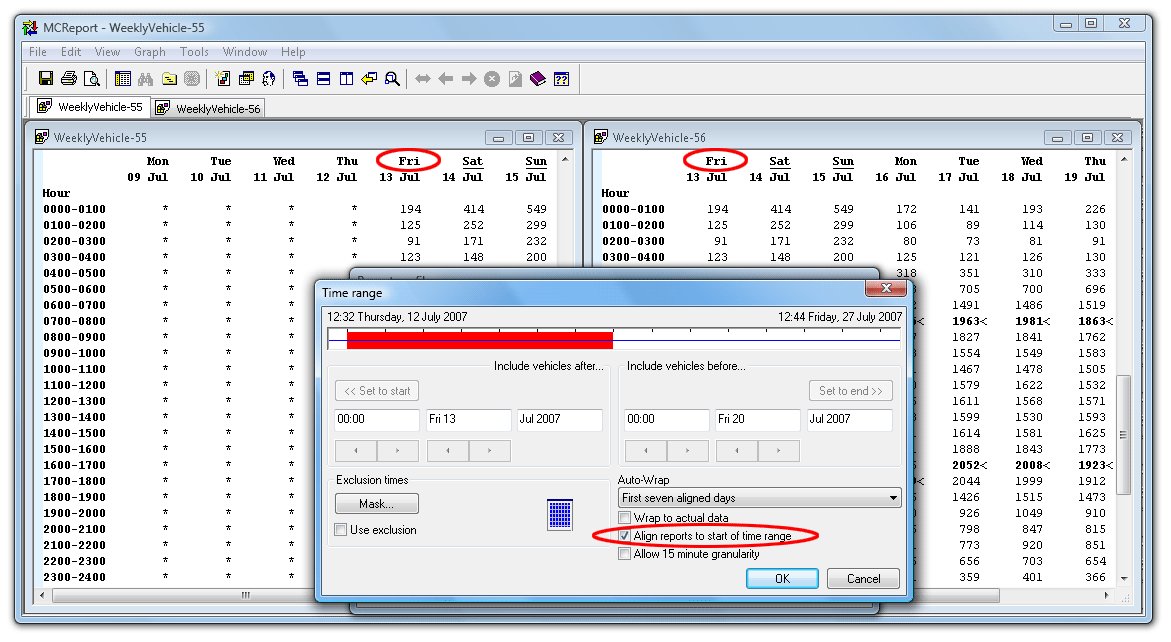
The default behaviour of the Weekly Vehicle Counts report is to align to the first weekday. For a dataset that starts mid-week, a single week of data will span two pages.
To align the report to the start of the dataset, select the Align reports to start of time range option in the report's Profile. To restrict the report to a single week, consider using the First seven aligned days Auto-Wrap option.
The Virtual Week version of the Weekly Vehicle Counts report merges multiple weeks of data into a single, averaged week.
Each hourly total in this report is the sum of the same hour from each week, divided by the number of weeks that data is available for that period. As this report is a mathematical representation of average vehicle flow, totals are displayed as floating point numbers.
The layout of the Virtual Week version is identical to the continuous Weekly Vehicle Counts report, with the exception that dates are not included at the top of each day column.