
Vehicle Counts
The Vehicle Counts report is based on a 24-hour format. Each day of data is represented by 24 hourly totals, with a user defined hourly breakdown, called time drops. For example, a time drop of 15 minutes will produce an additional four totals below the hourly totals, for each 15 minute period.
Time drops that do not contain complete data are represented by a hyphen (-). These include time drops excluded by the time filter, and partial drops where the dataset starts or ends mid-drop. Hourly totals will not be displayed if there are any missing drops.
Each day in the report includes a day heading, with the date and the total vehicles in the report Profile for that day. Days containing complete data also include a day summary, with the AM and PM peak hours to the resolution of the time drop, and the total vehicles in that hour.
The AM and PM Peak Hour Factor is a measure of flow variation within the peak hour. It is calculated as the total of the peak hour, divided by the peak bin total multiplied by the drops per hour. Therefore, if the peak hour total is spread equally across the time drops for that hour, the Peak Hour Factor will be equal to 1. The Peak Hour Factor normally ranges between 0.7 and 1.0.
The last column on a Vehicle Counts report is simply the first column from the next day. This is for highlighting a peak hour that spans across a day boundary. Note that these figures are not included in the daily total.
The Vehicle Counts report has a number of formatting options, including the size of the time drops. These are accessed via Properties in the report's right-click menu.
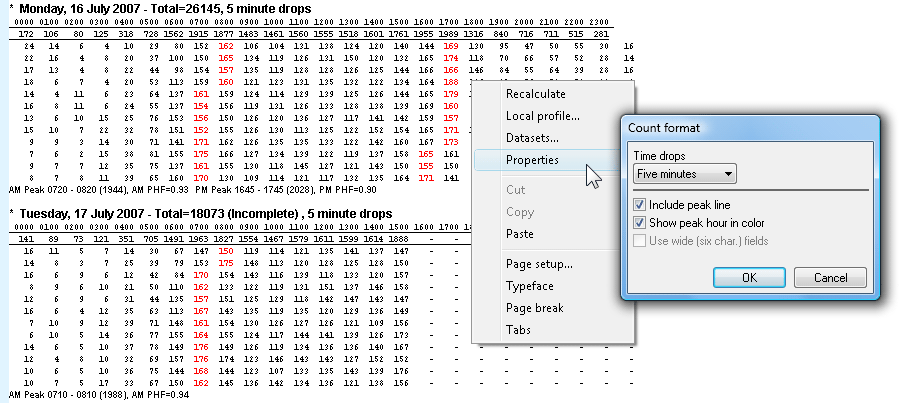
| Option | Description |
|---|---|
| Time drops | Specifies the interval for each time drop. |
| Include peak line | Includes the day summary row with AM and PM peaks. This line will not appear if a day does not contain complete data. |
| Show peak hour in colour | Drop totals that are part of the AM and PM peak hours will be displayed in red. Note that the peak hour is calculated to the resolution of the time drop, and may span two columns. |
The Virtual Day version of the Vehicle Counts report merges multiple days of data into a single, averaged day.
Each drop total in this report is the sum of the same time drop from each day, divided by the number of days that data is available for that period. Note that all totals are rounded to the nearest integer.