Individual Vehicles
The Individual Vehicles report displays speed, wheelbase, headway, class and a scaled wheel picture for every vehicle. Each line of the report represents a single vehicle, with the time and date the vehicle was logged by the Roadside Unit.
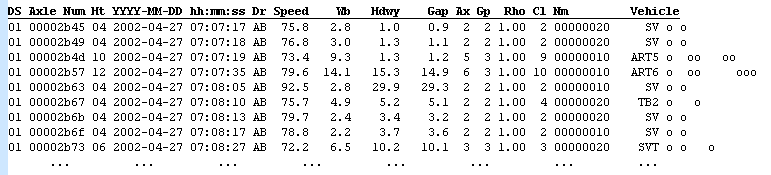
| Column | Description |
|---|---|
| DS | Tagged dataset index. |
| Axle Num | Dataset axle index. |
| Ht | Number of axle hits in the vehicle. |
| Date and Time | Date and time of the first axle in the vehicle. |
| Dr | Direction of travel of the vehicle. |
| Speed | Speed of the vehicle. Units of measurement are determined by the report Profile. |
| Wb | Wheelbase of the vehicle. Units of measurement are determined by the report Profile. |
| Hdwy |
Headway - time since the first axle of the last vehicle travelling in the same direction. |
| Gap |
Gap - time since the last axle of the last vehicle travelling in the same direction. |
| Ax | Number of axles in the vehicle. |
| Gp | Number of axle groups in the vehicle. |
| Rho | Sensor correlation factor. |
| Cl | Class of the vehicle. |
| Nm | Not defined - technical purposes only. |
| Vehicle | Class name and scaled wheel picture of the vehicle. |
A graphical representation of the axle events for each individual vehicle may be obtained using the Axle Inspector. This is a timeline of sensor hits that MCReport has partitioned into a vehicle, based on the selected classification scheme. To display, simply double-click any row in the report.
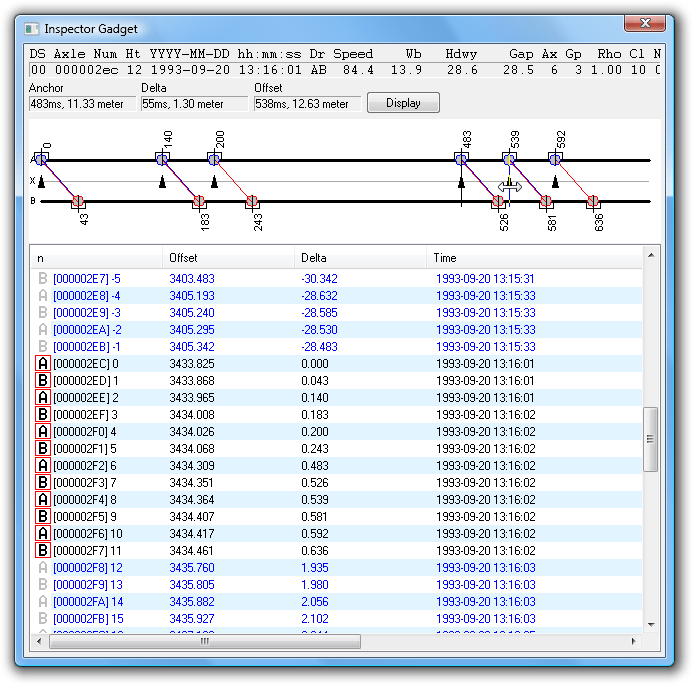
The two sensor hit streams in a dataset are represented by the black lines, marked A and B. A circle indicates axle hits on each sensor and are labelled with the time in milliseconds since the first hit. A line is drawn from each hit at an angle determined by the speed of the vehicle. Since the speed of each vehicle is determined by the first A and B hits, then the first A and B hit lines will always overlap.
Subsequent hit lines are drawn at the same angle, and under perfect operating conditions the corresponding A and B pairs will overlap. Any gap between these pairs of hits indicates a lateral movement in the sensors, or a change in vehicle velocity.
The black triangles on the X line represent "axles" used by MCReport, after processing and filtering, to classify the vehicle
The time and distance between sensor hits can be measured using the inspector's time markers. Moving the mouse over the timeline moves the Offset marker. Clicking will move the Anchor marker to the current location. The Delta field at the top is the difference between the anchor and offset markers.