Spectrum of Axle Hits
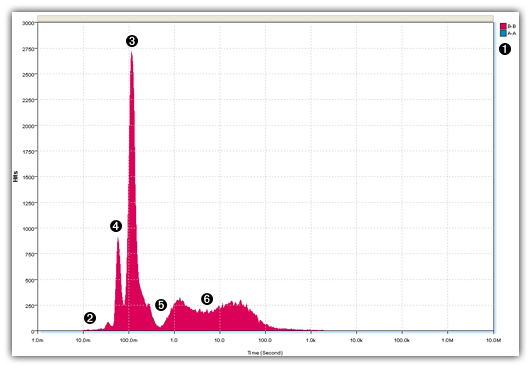
The Spectrum of Axle Hits report, or Hit Spectrum, is a histogram of the time difference between successive sensor hits. This chart is one of the most useful tools for instantly verifying data quality.
MCReport scans a dataset, and keeps a tally of the time between successive sensor hits, grouping them by the order of hits: A to A, B to B, A to B or B to A. The Hit Spectrum shows the A to A and B to B plots by default - the time between hits on the same sensor provides the most useful information.
The time between sensor hits can vary over a huge range, so the horizontal axis is logarithmic. This allows a range from one millisecond to ten million seconds.
A typical Hit Spectrum is characterised by the following:
-
With good quality classification data, the A to A and B to B plots should perfectly overlay each other. Only the top-most plot may be visible.
-
Peaks in the left-most region, from around 10 to 30 milliseconds, depict spurious hits caused by sensor noise.
-
A sharp peak somewhere around 100ms represents the product of speed and wheelbase of the most frequently recorded vehicles (usually cars).
-
Additional smaller peaks in this region are due to bi-axle and tri-axle groups, or trailers.
-
A trough approaching the x-axis indicates low congestion.
-
The remainder of the Hit Spectrum, usually above 400ms, is characterised by a broad hump that represents the distribution of inter-vehicle times.