Speed
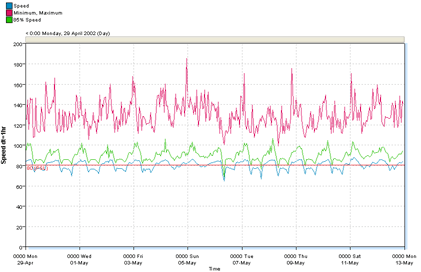
The Speed report is a time-based plot of average vehicle speed per selected integration period. By default, the report also shows a plot of maximum vehicle speed, and a horizontal marker for the posted speed limit (PSL).
Right-clicking on the report and selecting Properties displays the report's options.
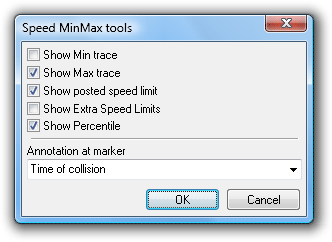
Show Min trace displays a plot of minimum speed per integration period. Show Percentile displays a plot for the first percentile, and Show Extra Speed Limits displays horizontal markers for each of the speed limits, per the settings in the Speed page of the report's Advanced Profile options.
The Annotation at marker is a piece of text that appears next to the time of the marker, which can be placed with the cross-hairs. The drop-down list is also user-editable.
The Speed report also has two special Display Span options for a Virtual Day or Virtual Week.