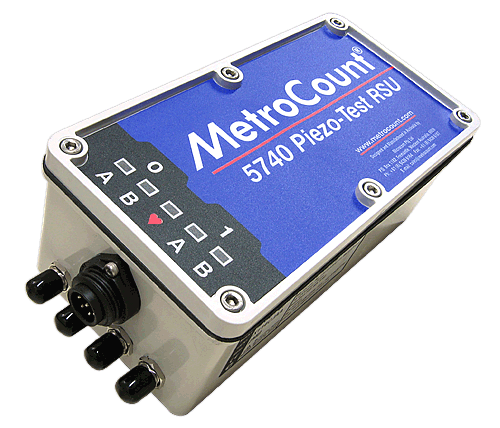
The MC5740 is a new addition to the MC5700 series of RSUs, designed for short-term characterisation of piezo-sensor installations. Rather than logging vehicles, the unit stores a histogram of piezo output at 15-minute or hourly intervals, along with temperature, leakage resistance, capacitance and noise, for up to 30 days. The MC5740 is physically identical to the MC5710, with four inputs.
The MC5740 also has a number of diagnostic tools, including instantaneous measurements of leakage, capacitance and noise, and an oscilloscope mode to display piezo output waveforms.
All tools are available in both MCSetup and MCSetLite.
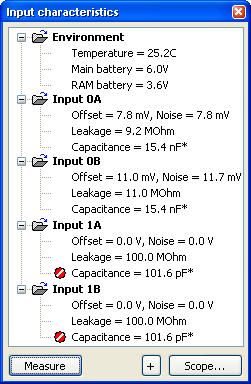
The MC5740's View mode displays an instantaneous measurement of all four inputs. Measurements that are outside reasonable values are flagged with a red icon.
The following example shows the measurements for a pair of BL sensors with long feeder-cables connected to channel 0. Channel 1 is unconnected.
The measurement can be repeated by clicking Measure button.
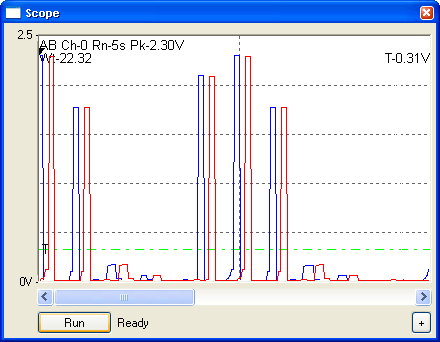
The MC5740's Oscilloscope view is entered by clicking the Scope button. When running, the RSU is sampling all four inputs continuously. The Oscilloscope view displays a continuous set of samples as a waveform, for a period of 2, 5 or 10 seconds. The input waveforms are displayed a pair at a time (A and B). The current channel and record length can be selected from the menu button at the bottom right.
Clicking the Run button starts the software looking for a voltage on either input above the trigger level. The trigger level is represented by the green line, and can be adjusted by dragging. Once triggered, samples will be recorded for the selected record length, then displayed.
Unlike a regular oscilloscope, the MC5740 performs digital noise processing and debounce on the piezo waveforms.
Waveforms can be saved, and viewed later via MCSetup's Technical menu.
The MC5740 is configured and setup like any other 5700 series RSU. The logging interval (usually 15 or 60 minutes) and the full-scale reading (500mV, 2.5V, 5V, 25V) are both configurable. Once running, the unit detects peak values and logs them in a histogram, for all four inputs. At the configured interval the histogram is stored, along with a measurement of input characteristics. The resulting dataset is known as block data.
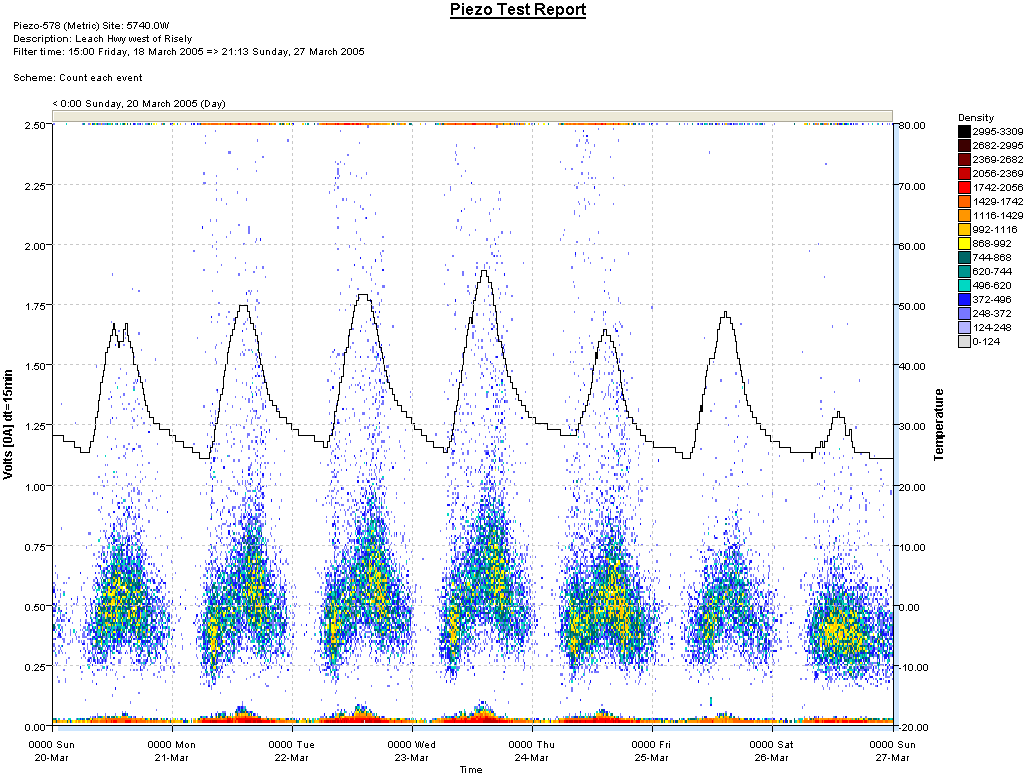
MCReport's Piezo Test report analyses block data. The stored histograms are used to create a density plot of peak voltages versus time. The report will also plot one of the input characteristics - temperature, leakage, capacitance or noise.
This report instantly characterises piezo installation behaviour over time. The example above shows a definite relationship between temperature and sensitivity. However, there is always a clear delineation between real sensor hits and base-level noise, indicating a reliable installation.
The report also indicates the dynamic range of a piezo sensor. The predominant vehicles (cars) are causing sensor peaks below one volt, however heavy vehicles regularly result in peaks in excess of the 2.5V full-scale reading on this test.


