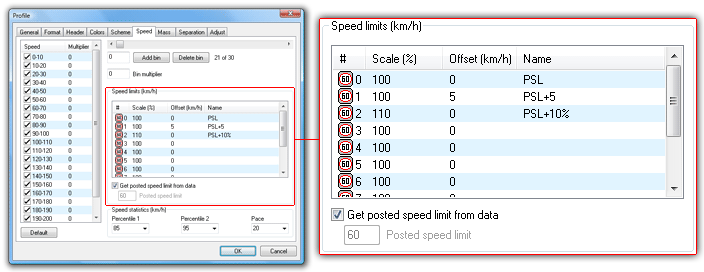
The Posted Speed Limit (PSL) is the speed limit at the site where data was collected, and is used as the basis for speed statistics such as the number of speeding vehicles. The PSL can be settings are located on the Speed page of the Advanced Profile options.
The PSL can be automatically derived from the tagged datasets. With the Get posted speed limit from data option checked, MCReport will scan the Description field of the tagged datasets' headers, looking for a PSL in the following form:
-
Must be enclosed in angle brackets < >
-
Default is km/h. Append an 'm' or 'M' for mph.
-
The PSL can appear anywhere in the description, but other angle brackets cannot be inserted when using this feature.
| Example Site Descriptions | |
|---|---|
| km/h | mph |
| Hay St <60> | <40 mph> Speed test, Euston Road |
| <60km/h> Hay Street | ACPO test, Harrow Road <40m> |
| Hay St, <50 km/h> study | Harrow Road, PSL=<40 MPH> |
With this option checked, if MCReport does not find a valid speed limit, or there are multiple tagged datasets with conflicting PSLs, the PSL will be set to zero.
The best time to insert the PSL into the Description field is when a RSU is setup, and when creating Site Lists. For existing datasets the PSL can be inserted into the description using the Transform data file feature in MCReport's File Tree.
When the automatic PSL option is unchecked, the PSL can be manually entered in the Posted speed limit box provided.
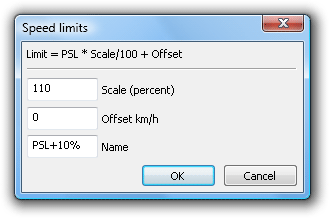
The Speed limits list allows up to 10 additional speed thresholds to be set based on the PSL, using the formula (PSL * Scale/100) + Offset. The Scale column is a percentage, and Offset can be a positive or negative amount, in the same units as the PSL. Each additional limit can also be uniquely named.
To edit a speed threshold, simply double-click. Note that the first limit in the list is always the PSL, and cannot be changed.
For example, given a PSL of 80, a scaling percentage of 110 will result in a speed threshold of 88. For a simple offset, leave the scaling percentage at 100 and use the Offset field.
Thresholds which are left as the same as the PSL (100% + 0) will not be displayed in reports.
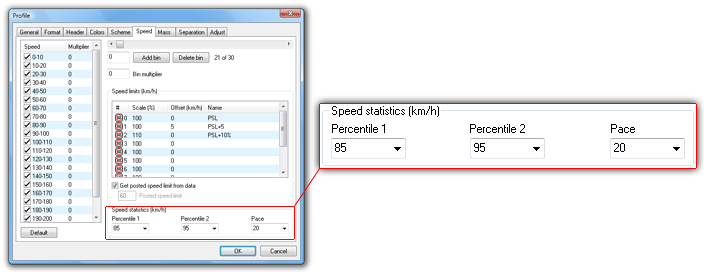
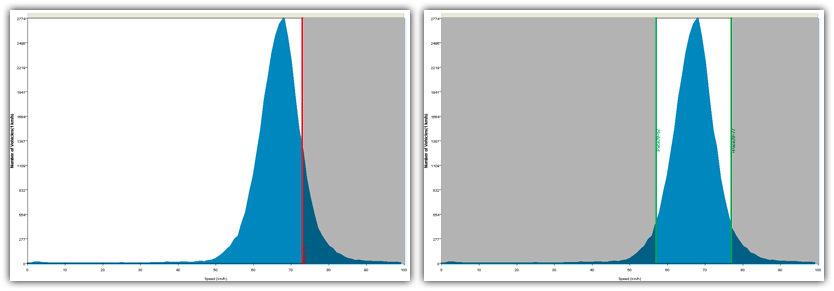
The nth speed percentile is the speed below which n% of vehicles were travelling. For example, the commonly used 85th percentile is the speed below which 85% of vehicles were travelling. MCReport supports two speed percentiles, which can be set in 5% steps.
The speed pace is a continuous band of speeds n km/h or mph wide that contains the largest number of vehicles. The speed pace is a measure of the dispersion of speeds at a site, based on the number and percentage of vehicles within the pace. The speed pace can be set in 5 km/h or mph increments.
For example, given a speed histogram, the 85th speed percentile will be a vertical line, with 85% of vehicles to the left. A 20km/h pace is a band 20km/h wide that contains the most vehicles.
Many speed-related reports combine the above speed limits and statistics into a compact block. An example of the form of this is provided below.
|
Vehicles = 125765 Posted speed limit = 80 km/h, Exceeding = 84352 (67.07%), Mean Exceeding = 86.88 km/h Limit 1 (PSL+10%) (80 * 110%) + 0 = 88 km/h, Exceeding = 27223 (21.65%) Maximum = 174.7 km/h, Minimum = 0.0 km/h, Mean = 83.2 km/h 85% Speed = 90.0 km/h, 95% Speed = 95.8 km/h, Median = 82.4 km/h 20 km/h Pace = 73 - 93, Number in Pace = 107015 (85.09%) Variance = 60.72, Standard Deviation = 7.79 km/h |


