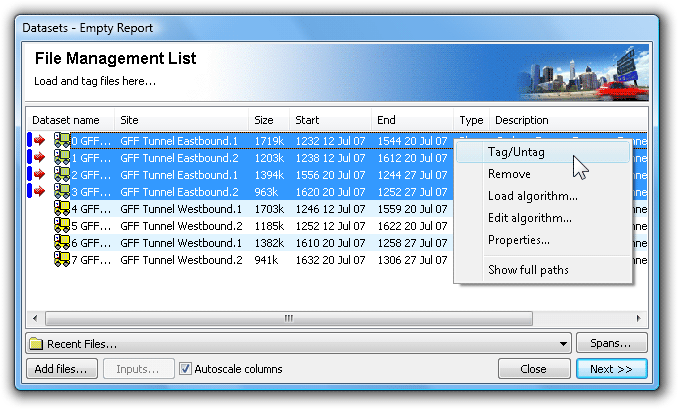
The File Management List contains a list of datasets that have been loaded into memory, ready for analysis. Datasets are tagged for inclusion in a report, as indicated by the red arrow icon. The File Management List is displayed as part of the Report Wizard when generating a new report, or when swapping datasets on an existing report.
The File Management List is a temporary list. Loaded datasets remain in the list for the current session of MCReport, or until they are explicitly removed. The list may contain up to 16 datasets.
Most reports support tagging of multiple datasets. This may be required for combined, multi-lane analysis where a single RSU was used per lane, and for time-contiguous datasets for a single site.
There are several methods for loading datasets into the File Management List:
-
via the File Tree,
-
using the Recent Files list, or
-
drag-and-drop.
The File Tree is the recommended method. Selecting files in a File Tree window, then clicking the New Report button will load them into the File Management List, up to a maximum of 16 datasets.
The Recent Files list, located at the bottom of the File Management List, contains the 10 most-recently loaded datasets.
Dragging files from another application is also supported. Files must be dropped on the title bar of MCReport's main window.
Tagged datasets are indicated by the red arrow icon next to their file name. At least one dataset must be tagged to generate a report.
To toggle the tagged status of a dataset, simply double-click it. To toggle a group of datasets, select them, and then select Tag/Untag from the right-click menu.
Note that some reports do not support multiple datasets. Selecting one of these reports in the Report Vortex will display a warning, and return to the File Management List.
Manually removing datasets from the File Management List is only required if the list is full. Simply select at least one dataset, right-click and select Remove.
A dataset can not be removed if it is tagged, or it is in use by an open report (indicated by the blue bar icon). To remove, firstly close any reports using that dataset.
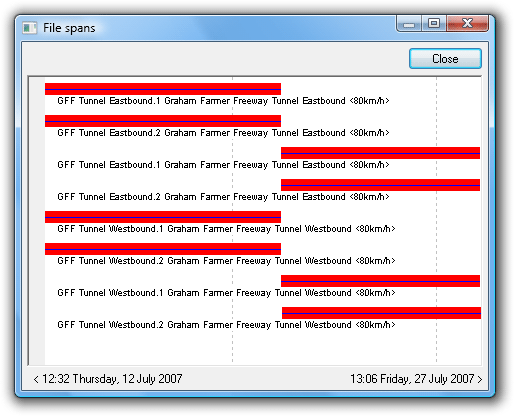
The Spans button in the File Management List displays a chart of the relative time-spans for the loaded datasets. The chart is scaled from the earliest start time to the last finish time, with each dataset represented by a red bar. Each dataset's blue line represents the time between the first and last sensor hits.


