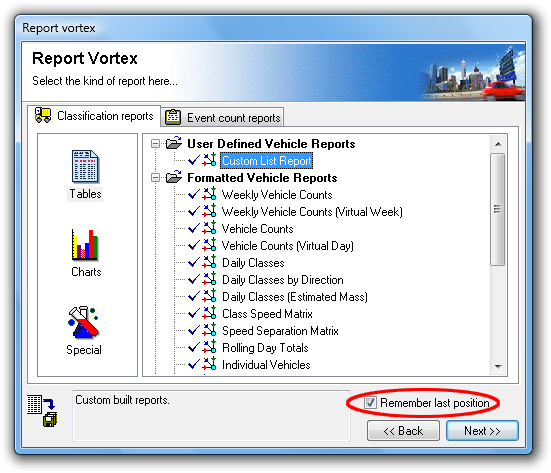
Report Types
The Report Vortex is the report selection stage of the Report Wizard. Reports are primarily grouped by their mode of analysis, Classification or Event Count, represented by the two pages at the top. Reports are then sub-grouped by output format:
-
Tables - pre-formatted, paginated text reports, and continuous text reports with user-definable columns and export options.
-
Charts - graphical reports, such as pie charts, time-based plots, dispersion plots and data-audit charts.
-
Special - generic and "standard" report formats.
![[Note]](MTEHelp/images/note.png)
|
Note |
|---|---|
| The Remember last position option automatically selects the last report that was generated - useful when generating several of the same report. | |
Classification analysis requires datasets collected using a Classifier Layout, where the A and B axle sensors are placed in parallel and a known distance apart. From this, MCReport derives vehicles.
Firstly, MCReport performs the complex task of examining the raw data and partitioning groups of sensor hits into likely vehicles. This is based on a number of time and distance parameters determined by MCReport.
The next step is to determine the axle configuration of each vehicle. The first A and B hit pair in the group determines the direction of the vehicle, and the speed of the vehicle, based on the sensor spacing. From the speed, the time between the remaining hit pairs determines the spacing between axles.
The final step is to apply a classification scheme, based on the axle spacings in the vehicle. MCReport offers a choice of standard and special-purpose classification schemes, called OEM Schemes. Other classification schemes can be added to MCReport using user-definable External Schemes.
From here, the set of vehicles can be filtered, and formatted into a vast array of reports.
Event Count analysis treats the raw A and B sensor hits as user-selectable events - usually counts. MCReport refers to the definition of an event as the Count Method, which may be one of the following:
- raw counts,
- counts divided by 2,
- counts divided by a custom factor,
- gaps above a certain length (in seconds), or
- following gaps, defined as a starting gap and a following gap.
Datasets collected using a Count Layout should only be analysed using Event Count reports. Attempting to analyse this type of data as vehicles will produce meaningless results.
Classifier Layout datasets can be optionally analysed with Event Count reports. These may be useful for obtaining approximate counts for periods where one sensor has failed, or for gap analysis.
Most reports support inclusion of multiple datasets in a single report. This may be necessary for combining results from multi-lane sites with one RSU per lane, and for time periods spanning multiple datasets.
There is an icon next to each report in the Report Vortex, indicating multi-file support as shown in the following table.
MetroCount datasets contain a digital Signature, which controls access to reports in the Report Vortex. A dataset's Signature type is inherited from the RSU that created it, such as Plusand Regular. The Signature type is one of the columns in both the File Tree and the File Management List.
| Icon | Description |
|---|---|
|
|
Report available |
|
|
Report unavailable due to incompatible dataset Signature type |
Report Vortex availability icons
Reports that are unavailable due to an incompatible Signature type are indicated by a lock icon next to the report name. Selecting one of these reports and clicking the Next button will display a message indicating the required Signature type to use that report.
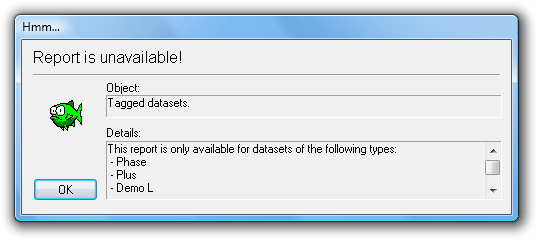
When tagging multiple datasets, report availability will be determined by the lowest Signature type.