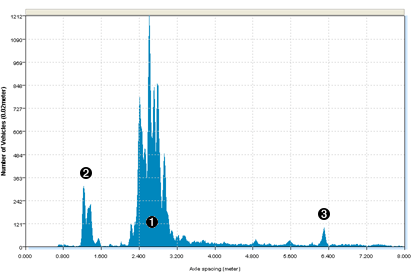
The Axle Position Histogram is a histogram of inter-axle spacings within vehicles. This report will usually have a characteristic shape corresponding to common axle spacings, making it an extremely useful tool for verifying data quality.
The Axle Position Histogram can be characterised by:
-
A group of spikes representing the most common passenger vehicles, and light trucks.
-
Spikes corresponding to the double and triple axle groups of heavy vehicles (for datasets containing a noticeable percentage of these vehicles).
-
Smaller spikes corresponding to the longer inter-axle spans in heavy vehicles, such as buses.
The Axle Position Histogram can be used to check for:
- matching sensor length, and
- correct sensor spacing.
Characteristic spikes in the histogram can be checked against known good data from the same area. If these spikes deviate in position by a significant amount, one of these problems may exist, and speed and classification should be considered suspect for this dataset.
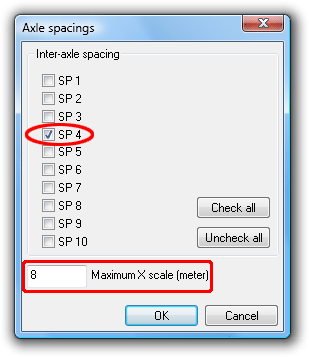
For example, it is possible to target the double axle group on the back of an articulated truck, which is usually one of a few standard distances apart. Selecting Properties from the report's right-click menu will display the axle spacings filter.
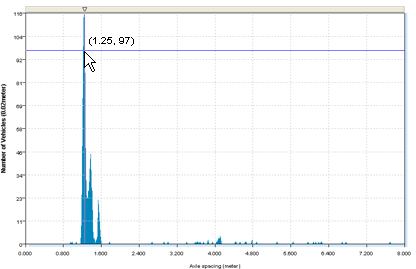
Selecting SP4 in this case will display only the spacings between axles four and five. Note also the X-axis scale can be modified to increase resolution.
Filtering should create a few clearly defined spikes that can be verified using the cross-hairs. Again, deviation from known values may indicate a sensor installation problem.
For bidirectional data with a suspected problem, it is possible to distinguish between different sensor length and incorrect spacing. Different sensor length will result in spacings that are too short in one direction, and too long in the other. If filtering for one direction using the report Profile's direction filter moves the Axle Position Histogram left or right, this indicates different sensor length. If the report is unmoved, then incorrect spacing is the likely cause.


