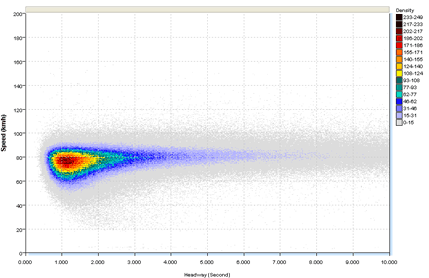
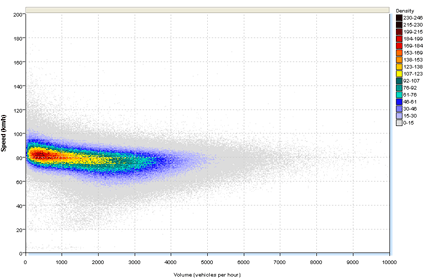
MCReport has four dispersion or scatter plots:
- Speed vs Separation
- Volume vs Speed
- Density vs Volume
- Volume vs Density
Every vehicle is represented by a single point on the graph. Point density is indicated by the density colour glide specified in the report Profile.
These plots portray differing characteristics of traffic flow, which are normally based on theoretical values in traffic engineering text books. They can be very useful when analysing data on roads that are at or near capacity, or for before and after studies of road works such as traffic calming.
The Granularity option in the Format page of the Advanced Profile options adjusts the resolution of these reports. A higher granularity gives finer resolution, but require more vehicles to build any significant density.
The horizontal axis of the Speed vs Separation can be modified to give more resolution. Simply right-click, and select Properties.


