Custom List Chart
The Custom List report is a dual-pane split report, with a time-based chart on the right where fields included in the report can be optionally plotted. The entire time range of data is included in the chart, with the time step as the integration time.
Like dual-pane graphical reports, the left pane is the primary pane, with access to the report's Local Profile, datasets and Custom List Properties via the right-click menu.
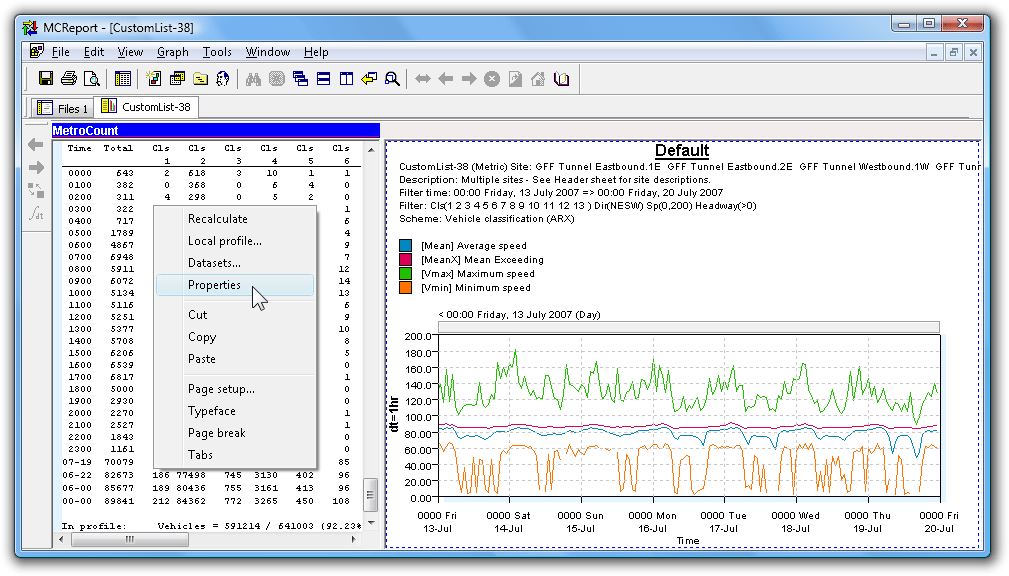
To print or save the Custom List chart it must first be activated by clicking anywhere within its pane. The blue MetroCount bar indicates the active pane, which print and save operations relate to. The usual graph rendering and scaling properties can be changed via the Graph menu in MCReport's main menu.
The check box next to each selected field in the Custom List report's Properties is used to include the field in the Custom List chart. Fields with a cross in the check box cannot be plotted.
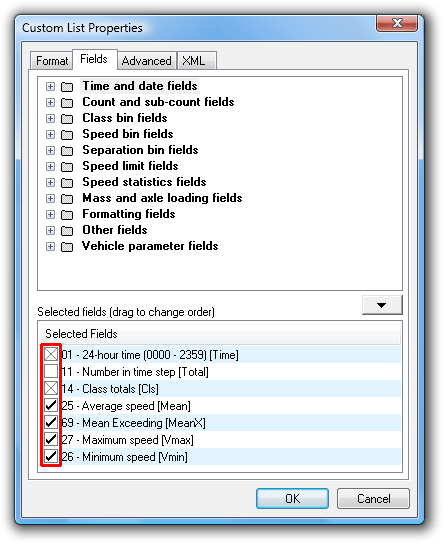
All selected fields are plotted on one vertical axis, so for best results, only select fields with a similar range in values.