Bin charts
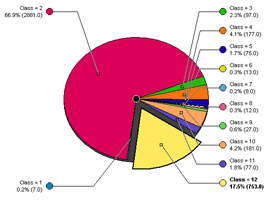
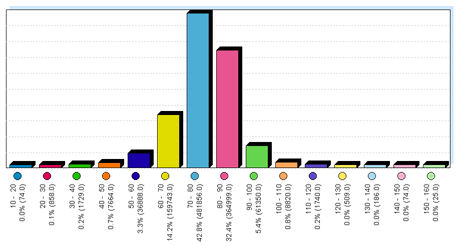
MCReport has two bin charts - the Class bin report, and the Speed bin report. These reports provide a graphical representation of the proportions of class and speed bins respectively. The Header Sheet also contains a table of class/speed bin totals and percentages.
Bin charts have four renderings, each providing a unique data representation. The most common renderings are bar or column charts, and pie charts.
The pie chart rendering is a three-dimensional, dynamic chart. The chart can be rotated to the angle that best represents the data by clicking and dragging the black circle in the centre. Individual pie slices can be highlighted by clicking the coloured circle next to the class or speed bin label.